 The sport of horse racing is jam-packed with opinions; from views on the riding styles of the top jockeys in the game, horses to follow and avoid, the pros and cons of the betting exchanges and plenty more besides. And, amidst this sea of opinion, frequently featuring amongst the hottest topics of debate is the subject of favourites – those horses that the bookmakers and betting public have determined to be the most likely winner of any given contest.
From the advocates who are happy to religiously back the “unnamed favourite” regardless of who that horse ultimately ends up being, to those – at the other end of the spectrum – who avoid favourites like the plague and come out in a cold sweat at the very mention of backing a horse at odds on. But which – if either – side has it right?
Here we take a closer look at the favourite, examining just how often they do actually win and whether it is as often as the odds suggest they should. We shall then go delving a little deeper into the stats to identify a handful of potentially successful windows of opportunity for those who do like to lend their support to the market leader.
Favourites: The Most Likely Winner?

As the shortest-priced runner in any given race, the favourite is, by definition, the horse deemed the most likely winner of the event. But does this hold true? Of course, favourites win and lose on a daily basis. One important thing to remember with favourites though is that unless they are odds on, then the market still believes that although they are the most likely winner they are still more likely to lose the race than win it. Favourite backers may look on in disbelief as a 6/4 jolly fails to deliver, but such odds do suggest a 40% chance of victory and a 60% chance of defeat, so it perhaps shouldn’t come as such a surprise.
Regardless of how they perform in any given race, if the market is correct, then over a large sample size favourites should boast a higher winning percentage than runners in any other position in that particular betting market. Favourites should win a higher percentage of races than second favourites, which should, in turn, win a higher percentage than third favourites and so on. To investigate whether or not this theory holds true in practice, we examined the results of every race held in Great Britain between 2002 and 2021, producing the results in the table below.
| All races 2002-21 | Bets | Win Percentage | Return On Investment (ROI) |
|---|---|---|---|
| Favourite | 172,539 | 34% | 93% |
| 2nd Favourite | 153,119 | 20% | 88% |
| 3rd Favourite | 145,799 | 14% | 85% |
So, how often does the favourite win? Around 34% of the time is the answer, based on these figures. And we can also see that the predicted pattern of the favourite winning more often than the second favourite, who in turn wins more than the third favourite also holds true.
Note here that the differing bet tallies for each column are a result of the data only counting outright favourites, outright second favourites and so on. Joint or co-favourites were not included. Regardless of that caveat, the sample size is still easily large enough to lend substance to the results.
The discovered pattern is really no more than would be expected, but what is interesting in the above table is the return on investment (ROI) column. Now, whilst a 93% ROI for the favourite, representing a 7% loss of total stakes, is certainly nothing to write home about, it is nevertheless significantly better than the 88% and 85% of the second and third favourites respectively.
Favourite/Longshot Bias
Taking the above a little further, what we are seeing here is an example of what is known as the favourite/longshot bias – a phenomenon found to exist in a number of sports whereby, over time, the greatest returns are generated by placing bets on the shortest-priced runners, with returns steadily diminishing as the odds increase.
Possibly the largest study in this area was the Snowberg and Wolfers study from 2010 which analysed the results of a whopping 6 million+ races. And what they found was pretty striking. Based on that extensive sample, backing the favourite would have returned a 94.5% ROI, backing all runners between 3/1 and 16/1 would have provided an 84% ROI, with the return to backers descending to a paltry 39% on all runners priced at 100/1 or greater.
Favourites: The Shorter, the Better
Having established that favourites win more races than any other runners, and also provide a higher Return On Investment (albeit still at a loss), we next sought to examine whether the favourite/longshot bias existed within our sample of 172,539 outright favourites. Bearing the results of the Snowberg/Wolfers study in mind, what we would expect to find here is that the greatest winning percentage and returns should be found amongst the shortest-priced favourites.

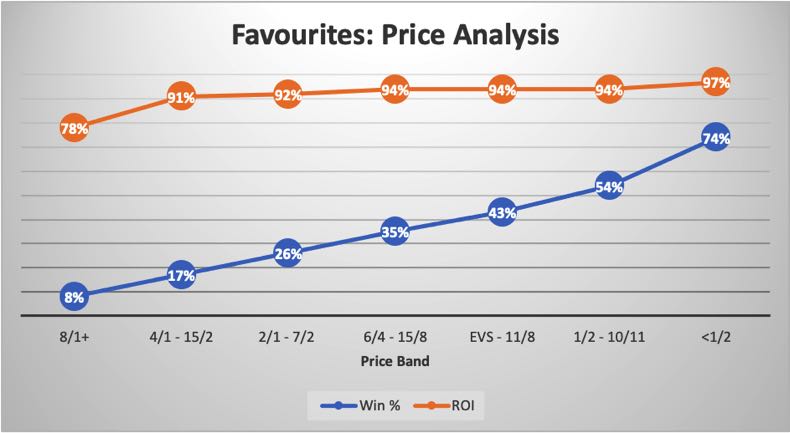
Looking at the above chart, we find that the favourite/longshot bias is indeed in evidence within our sample, with the ROI increasing overall with each decreasing price bracket. In terms of long-term returns, the shorter priced the favourite, the better the bet – albeit that even the shortest odds category still returned a loss of 3%.
The above information is also useful in displaying the spread of winning favourite percentages, illustrating that our 34% figure for all races is very much an average and varies markedly across the price bands, from just 8% at 8/1+ and all the way up to 74% to those priced at 1/2 and below. Whilst this is really only a function of the odds themselves, it is something which is not always understood intuitively by those new to the sport, and illustrates the point that all favourites are certainly not created equally. Whilst it is surprising to see a 1/4 favourite beaten, the real shock with an 8/1 market leader comes when it wins.
Favourites: Typically Successful Avenues

What we have effectively learned so far is that the prices on offer about runners towards the head of the market are closer to representing the true or actual odds of the horse winning than those available for runners further down the betting list. When we speak of true odds in this manner, we mean those odds which, in the long run, would represent a return on investment of exactly 100%. The true odds on a coin toss for example would be even money. If able to back heads at evens, you may win or lose on any given toss, and indeed may rack up a sequence of wins and/or losses, but in the long run, you would expect to break even.
Bearing in mind that in the world of horse racing betting, the bookmakers always take out a percentage for themselves (known as the bookmaker’s margin), breaking even, i.e. achieving an ROI of 100%, would actually represent a reasonable result in the long run.
Of course, breaking even is not the driving inspiration for most punters, with the ultimate goal being to increase that betting balance. With that in mind, our final port of call was to delve a little further into the results of our 20-year sample, seeking areas where favourites have historically performed particularly well. Were there any courses or race types that helped edge a level stake punt on the jolly into that golden 101%+ ROI zone?
Favourites: Top Tracks
| Track | Bets | Win% | ROI |
|---|---|---|---|
| Goodwood | 2451 | 32% | 100% |
| Windsor | 3026 | 35% | 99% |
| Thirsk | 1875 | 34% | 98% |
| Ludlow | 1816 | 39% | 97% |
| Pontefract | 1932 | 34% | 97% |
When analysing the results across the 61 tracks included in our study, there was just one course that showed a level stakes net win for favourite backers. Sadly, Folkestone Racecourse closed in 2012, taking its 101% ROI and joint-top win rate of 39% with it. That leaves the home of the Glorious meeting, Goodwood, to top the pile, and whilst its 100% ROI doesn’t quite represent a road to riches, it is nevertheless significantly better than the 87% return of Cartmel, Epsom, Ffos Las and Towcester – the four worst-performing ROI tracks over this period. When looking at win percentage, Ludlow’s 39% came out ahead of the rest, with the 29% of York bringing up the rear.
Favourites Top Race Types
| Race Type | Bets | Win% | ROI |
|---|---|---|---|
| Selling Stakes (Flat) | 3041 | 38% | 97% |
| Claiming Stakes (Flat) | 3456 | 39% | 97% |
| Novice Handicap Hurdle | 2231 | 31% | 96% |
| Novice Chase | 5306 | 49% | 96% |
| Hunter Chase | 1685 | 43% | 96% |
Much as with the racecourses, there was no blind betting strategy that yielded a net win when it came to the various race types in our sample. There were, however, certain categories that performed significantly better than others, with the much-derided Selling Stakes and Claiming Stakes a little surprisingly topping the pile. Short on quality perhaps, but the evidence suggests these lowly events ought to be high on the lists of favourite backers.
The highest strike rates on offer came in the Novice Chase and Novice Hurdle categories which registered figures of 49% and 48%, respectively. Not enough for a net win, but way ahead of the 29% returned for Handicaps over jumps and on the level. Selling handicaps meanwhile performed worst of all, with a strike rate of just 25%.
Favourites: Best Bets
Nothing to edge us into a net win quite yet, but if we combine our results from the course and race type findings, we do begin to zero in on a selection of potentially successful strategies, with each of the five best performing tracks producing a category of races with encouraging results.
| Course | Race Type | Bets | Win % | ROI |
|---|---|---|---|---|
| Goodwood | Group Races | 152 | 44.10% | 111.20% |
| Windsor | All Non-Handicap | 635 | 46.80% | 105.40% |
| Thirsk | All Non-Handicap | 371 | 46.1 | 105.80% |
| Ludlow | Novice Chase and Hunter Chase | 91 | 50.5 | 108.80% |
| Pontefract | Handicaps | 637 | 32 | 102.40% |
Simply removing the poor performing handicap races was enough to make Windsor and Thirsk successful, whilst a similar strategy also prevailed at Goodwood, with further improvement coming when focussing on the high-class Group events. Pontefract was the odd man out amongst the flat tracks as – counterintuitively given the overall results – it was the handicap events that rewarded supporters of the market leader. And over the jumps at Ludlow, a combination of one of the highest favourite win percentages of any track, and two jolly-friendly race types was enough to see favourite backers into the black.
A word of caution must be added due to the necessarily smaller sample sizes compared to the overall picture, with the added proviso that what happened in the past isn’t assured to repeat in the future, but these are interesting results, nonetheless.
Summary

Give or take a percentage point, favourites in UK horse racing win around one-third of all races – a high enough percentage to provide a regular winning feeling to jolly backers, but still low enough to provide the anti-favourite brigade with plenty of ammunition.
34% is the highest winning percentage of any position in the betting market, but that in and of itself doesn’t make favourites a good bet. What our evidence does show, however, is that whilst you will still lose if betting blindly on every favourite, the level of losses will be lower than a blind bet on runners lower down on the betting list. And further to this, the shorter price the favourite is, the better the returns in the long run – something of a poke in the eye for those who decry odds-on favourites as the worst bets in town.
And, finally, by being a little more selective with our favourite-backing strategy, in focussing on certain courses and race types, we may even be able to sneak a net win. Perhaps those “unnamed favourite” backers don’t have such a bad strategy after all – particularly if they focus solely on Group races at Goodwood!
